
Depreciating the University of Edinburgh into the Ground
The University of Edinburgh has published its annual report for 2024-2025, including the audited financial statement. In his recent e-mail to all staff, Peter Mathieson states that “our expenditure growth continues to outpace our income growth.” This is technically true, but highly dependent on how we choose to define expenditure and income, and extremely sensitive to minor fluctuations. It also obscures the fact that depreciation is a major cause of financial pressures. In this post, we dig deeper into why this claim conceals the full story.
There are four key takeaways, which this post explores:
The University continues to make a sizeable surplus.
What financial pressures exist are significantly due to spiralling depreciation from irresponsible capital spending.
Management continues to use misleading metrics to justify a harmful narrative.
Firing staff will undermine financial strengths, as well as undermine the University’s academic mission.
NB: Endnotes are at the end of the text.
1. The University’s operations are making £1.8m per week EBITDA[1] surplus, up from £1.6m last year
The headline figures of the 2024-2025 financial year are presented in the Annual Report: expenditure growth since last year was 3.4%, while income growth was 3%, and our operating surplus[2] this past year was £20.1m. These are calculated using the figures reported for “total income” and “total expenditure”.
In previous posts, we have discussed the difference between operating surplus and EBITDA surplus; the latter is the difference between expenditure and income, without taking into account interest we pay on our loans, capital grant income, or depreciation and amortisation of assets (which we will come back to shortly). If we look at the year-on-year growth of the income and expenditure which are included in EBITDA calculations (as was usual before the University’s austerity drive), income growth is 3.7% and expenditure growth is 3%. In other words, our EBITDA income is growing faster than EBITDA expenditure.
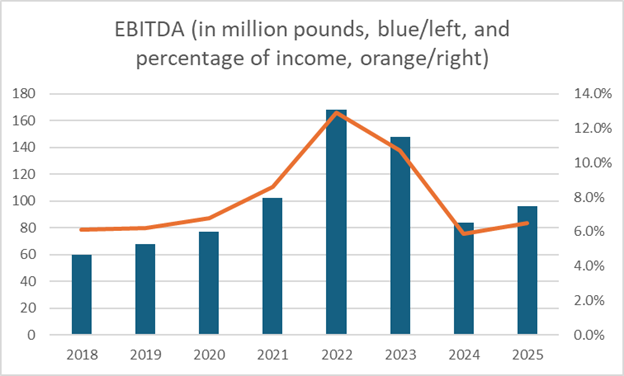
Our University’s EBITDA surplus has risen between the 2023-2024 and 2024-2025 financial years (FYs), from £84m last year to £96m this year. This means that the University’s income has surpassed its operating costs to the tune of £1.8m per week in FY2024-2025, against £1.6m per week the previous year.
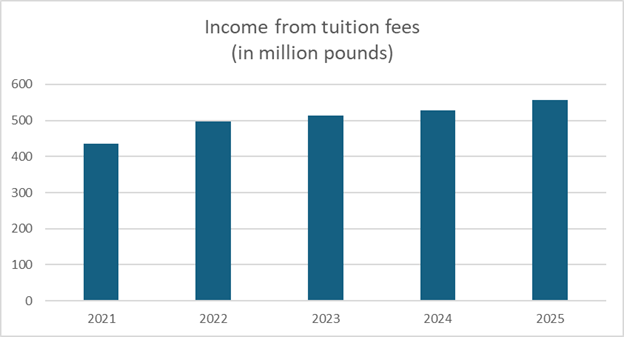
This significant surplus is supported by an increase in income and, in particular, income coming from tuition fees, which has consistently increased through the years. In FY2024-25, the University recorded £556m income from fees, up from £527m the previous year, and up from pre-Covid levels of £391m in FY2019-20. This confirms that education, the core mission of the University, is what generates increasing income.
So, our operating surplus is diminishing (£20.1m, down from £25m last year), while our EBITDA surplus is growing. Why the difference, and why the focus from management on operational surplus? It turns out that this has a lot to do with capital expenditure.
2. Irresponsible capital spending has left us with huge depreciation costs
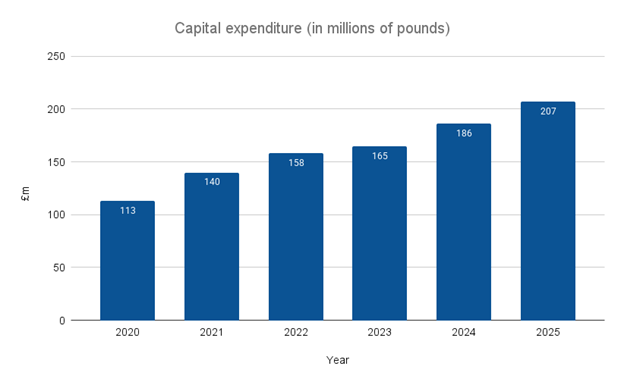
During the course of Peter Mathieson’s tenure as Principal from 2018, the University of Edinburgh has gone on a spending binge. The University’s 2024-25 Annual Report shows £207m in capital expenditure–an increase of 11% from the year prior. This, amidst a purported financial crisis! Since FY2019-20, Edinburgh has cumulatively spent nearly a billion pounds on capital projects.
The effect of this will last for years into the future. Due to how accounting rules work, the University must depreciate the cost of purchased assets by spreading it over multiple years or decades.[3] This adds up to the yearly expenditure item reported as “depreciation and amortisation”—by far the largest contributor to the difference between the EBITDA surplus and the operating surplus.
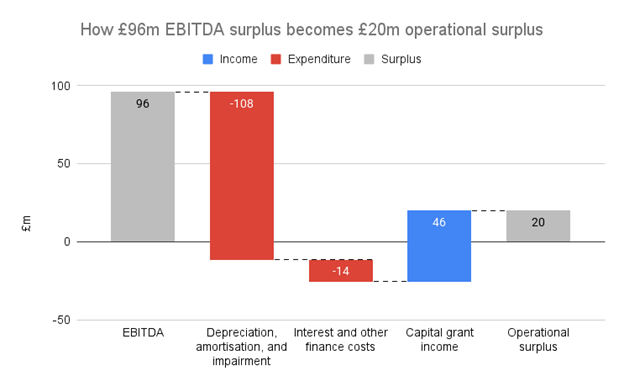
Because of exorbitant capital spending in the past, the depreciation and amortisation charge was £108m for FY2024-25 alone, an 18.7% increase from the previous year. Since our capital expenditure continues to increase year-on-year, we are also committing ourselves to increasing depreciation for the foreseeable future.
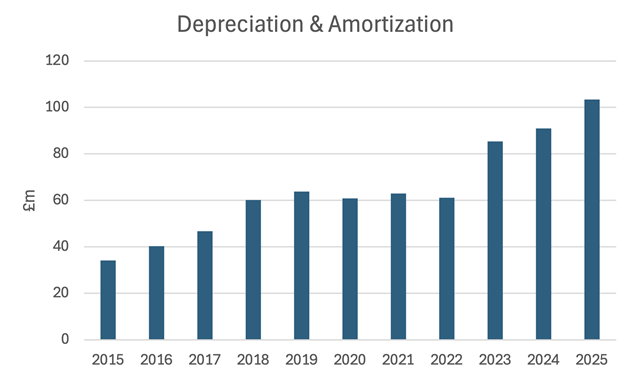
Consider the alternative: if depreciation and amortisation had remained at its FY2023-2024 figure of £91m, total expenditure would have only increased by 2.2%, rather than 3.4%—notably below the growth of income at 3%.[4] Instead, the reckless and unaccountable capital spending decisions by management have created a ‘crisis’ for which students and staff are paying the price.
This is also why management have been raising the targeted EBITDA rate (e.g. from demanding 7% to demanding 9%): more and more EBITDA surplus is ‘needed’ to cover the spiralling depreciation which is bringing the operational surplus down.
Management claims that “Although reduced capital investment and asset sales could improve short-term liquidity, they would not resolve the core issue of expenditure growth outpacing income growth”.[5] We can see clearly now that this is incorrect; as we have shown, capital expenditure contributes significantly to expenditure growth every year via depreciation.
3. The VC continues to use misleading metrics
But, for the sake of argument, let’s take management’s reasoning at face value: total income has increased by 3%, total expenditure has increased by 3.4%, and this is the “core issue”.[6] What does this mean, concretely? How much less should we have spent this year to bring the expenditure growth rate down to 3%, and therefore seemingly resolve our problems? In other words: how much is that extra 0.4% of last year’s expenditure, which would have saved us all? The answer is… £5.7m. (Clearly, we must have made fantastic progress towards the £140m savings target management set in February 2025.)
Just for fun, let’s pick a few expenditure items to put this figure into context:
As we saw earlier, depreciation and amortisation increased by £17m just this year. Again, this is the increase, not the cost—it was £17m more than last year.
The 11 “key management personnel” received a total compensation of £2.5m in 2024/25.[7] This would cover almost half of what would make our “core issue” disappear—a very large drop in a tiny ocean, to paraphrase the VC.
National insurance spending has increased this year by double the normal amount (an extra £6m) due to the changes in contribution rates and thresholds.[8] Because we’re dealing with changes in rates, this £6m is a one-off extra step increase to catch up with the new rates, which we will not see again next year (unless the rates change again).[9]
The University paid £11.6m in severance costs in 2024/25—a one-off expenditure, primarily due to the voluntary severance scheme run in early 2025, which won’t recur every year. (If redundancies stopped now, this would even contribute to a decrease in expenditure next year!)
More seriously, the point is that year-on-year income and expenditure increase rates (which are extremely sensitive to tiny changes) do not constitute a “trend”, and should absolutely not form the basis of an assessment of our long-term financial health—doing so would demonstrate a complete lack of understanding of financial modelling. Even if we completely bought into management’s narrative last year (which, as we wrote about extensively, we should not), it would be laughable to suggest that it still holds now and that nothing has changed.
These are the sort of numeracy skills taught across University of Edinburgh classrooms. They require a sensitivity to stocks versus flows, rates versus baselines, and a rudimentary understanding of uncertainty and sensitivity of predictive models. In fact, we’ve heard of at least some lectures at Edinburgh using prior statements from the VC as examples to illustrate the importance of modelling assumptions and error bars. It seems curricula will have to be updated!
4. Existing and further cuts are undermining teaching and learning
Across the university, funding for hiring in new fields, hosting speakers, and experiential learning has evaporated. Graduate student tutors are now harder to hire, meaning undergraduates have less productive times in small group settings, and PhD researchers have little or no opportunity to develop teaching skills in their specialisms, or earn money to pay rent and cover their bills. Research leave is being reduced, and staff to support course administration, technology, and research are extraordinarily squeezed. Smaller degree programmes and modules are under assault, reducing choice and undermining Scotland and the U.K.’s excellence in key fields. A year ago, a Senate Working Group already found significant deleterious effects of budget cuts on teaching and research.[10] This is being compounded and worsened. None of this push into austerity will stop spiraling depreciation costs, but it will mean worse student experience and less cutting-edge research. The VC insists there are risks to financial complacency. What is less clear is if he appreciates the risks from existing and further austerity.
5. A note on University surplus generation
It is worth saying a bit more about where this surplus is coming from. University management is notoriously opaque about internal finances—classifying things as ‘commercially sensitive’, or obscuring how transfers happen between units, or setting discretionary standards on topics like reimbursements.
Oftentimes, this obfuscation is used to inhibit collective decision-making—another nail in the coffin of the principles of faculty governance. As a result, even basic realities of what activities are surplus generating are little appreciated.
For instance, the College of Arts, Humanities, and Social Sciences is required to produce a surplus of 45%, with that figure rising to 52% by 2028-29. That means that for every pound of revenue brought in by CAHSS (e.g. from tuition fees), more than half will be paid to the central university. The equivalent figure for the College of Science & Engineering is 26%, rising to 32% by 2028-29. And for the College of Medicine and Veterinary Medicine, it is 8% rising to 11% by 2028-29.[11]
Colleges and Schools are the heart of the University both intellectually and financially.
Conclusion
The VC has blamed staff costs and government policy for financial pressures. But those financial pressures are far from severe enough to justify the proposed cuts. Even by management’s flawed narrative, a further £6m in savings would have made our “core issue” disappear, and we seem to have reached that point well before most of the impact of proposed redundancies would have been accounted for—and even before most of them would have happened. Using this narrative to continue justifying £90m in staff cuts is nothing less than shameless.
Likewise, senior management has never owned up to their own role in creating the pressures. Most obvious is the spiraling depreciation costs, on which the VC’s silence is deafening. The Edinburgh community deserves answers: Why has management got us stuck with such excessive depreciation costs, and what are they planning to do about it? And given that they have put us in this situation, should we have any faith that their restructuring of the institution in the name of ‘financial sustainability’ will result in anything but further harm?
Joint Unions Finance Working Group
27 January 2026
Endnotes
[1] EBITDA is earnings before interest, taxation, depreciation, and amortization. See our previous blog post for more details.
[2] This year's Annual Report refers to this figure as "surplus before other gains and losses". The annual reports in the last decade have used different names for this quantity, with the most common being "operating surplus", which is also used by management in their recent communications, and which we will continue to use in this blog.
[3] For example, a building is typically depreciated over 50 years, meaning that 1/50th of its value will be reported as expenditure each year over the 50 years following its purchase. See Annual Report and Accounts 2024/25, p.61
[4] Using non-EBITDA figures for total income and total expenditure, excluding USS movements. See Annual Report and Accounts 2024/25, p.36
[5] Annual Report and Accounts 2024/25, p.36
[6] Annual Report and Accounts 2024/25, p.36
[7] Annual Report and Accounts 2024/25, p.69
[8] Annual Report and Accounts 2024/25, p.67
[9] Let’s illustrate the principle with a simpler example: pick £100 worth of salary costs (outside of NI), say the NI rate goes from 10% to 15%, and see what happens to the NI costs from one year to the next.
Year 1, 10% NI rate: £10
Year 2, 10% NI rate: £10, no increase from year 1
Year 3, 15% NI rate: £15, £5 increase from year 2 (+50%)
Year 4, 15% NI rate: £15, no increase from year 3
The £5 increase in year 3 corresponds to the £6m increase on NI costs in 2024/25. We will pay more NI in the years following this, but this won’t be an extra expenditure increase anymore; the NI costs will go back to growing at the same rate as salary costs, as they are essentially a flat percentage of salary costs.
The key here is that we are looking at expenditure growth, as a percentage of the previous year’s expenditure, which results in big steps like this in the year of a contribution rate increase. It also shows how extremely sensitive this metric is, and why it should not be relied on for long-term modelling or measurements of financial health, as management have been doing.
[10] https://registryservices.ed.ac.uk/sites/default/files/2025-05/20%20May%202025%20-%20Agenda%20and%20Papers_1.pdf p.78 for the report